
This PRTG Network Monitor Review is designed to explain and make simple all that you need to know about this network monitoring tool from Paessler and get the most of it.
PRTG Network Monitor is an abbreviation for Paessler Router Traffic Grapher. It was developed with the aim of providing an effective monitoring system that could run without any manhandling. Today, PRTG Network Monitor is one of the most sort after and most used IT Infrastructure monitoring tool.
Its main functions are to offer monitoring services and the collection of statistics automatically from various hosts like routers, switches, firewalls, etc. to help network and system administrators have a complete overview and real-time information about their network and IT infrastructure.
PRTG Network Monitor Features
PRTG Network Monitor comes with several features and to make sense of them, we shall explain each one in detail below;
(1) Bandwidth Monitoring
Bandwidth monitoring enables you to see the traffic utilization on your network. It shows you upload speeds and download speeds, with this you can see who is churning out more bandwidth on your network. With PRTG Network Monitor, you can see the bandwidth utilization of every device and every application running, this is made possible by the Simple Network Management Protocol (SNMP), Windows Management Instrumentation (WMI), and NetFlow. There are several network monitoring sensors built into the PRTG Network Monitor and these are shown graphically below.
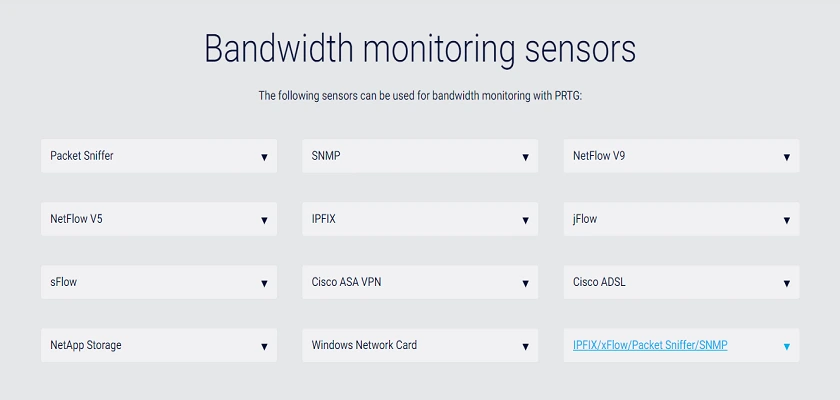
Let’s take a look at what the various bandwidth sensors are capable of delivering to you.
Packet Sniffer
The first is the packet sniffer sensor. It functions by scanning the header information of the entire traffic flowing in your network. It is able to show you the following data;
(i) Chat sessions (Internet Relay Chat and AIM Instant Messenger Chat).
(ii) File Transfer Protocol and P2P.
(iii) Remote Desktop Protocol sessions, Telnet, SSH, and VNC sessions.
(iv) Mail
(v) World Wide Web
(vi ) Citirx
NetFlow Version 5 Sensor
The second PRTG Network Monitor Bandwidth Sensor is the NetFlow Version 5 sensor. This sensor shows traffic by type and traffic by channels for NetFlow Version 5-supported devices. The data it shows you are shown below;
(i) Chat sessions (Internet Relay Chat and AIM Instant Messenger Chat).
(ii) File Transfer Protocol and P2P.
(iii) Remote Desktop Protocol sessions, Telnet, SSH, and VNC sessions.
(iv) Mail
(v) World Wide Web
(vi) Citirx
Next up on the list of PRTG Network Monitor Bandwidth Monitoring Sensors is the sFlow sensor.
sFlow Sensor
The sFlow sensor performs similarly to the NetFlow Version 5 sensor by showing traffic by type and traffic by channels for devices that support sFlow. The data it shows you are again similar and are shown below;
(i) Chat sessions (Internet Relay Chat and AIM Instant Messenger Chat).
(ii) File Transfer Protocol and P2P.
(iii) Remote Desktop Protocol sessions, Telnet, SSH, and VNC sessions.
(iv) Mail
(v) World Wide Web
(vi) Citirx
Explore the sFlow Sensor
The next sensor on the list is the NetApp Storage Sensor.
NetApp Storage Sensor
This sensor functions by using the Simple Network Management Protocol (SNMP) to scan the Network Interface Card on a NetApp device. It will show you incoming and outgoing traffic with any errors detected.
Simple Network Management Protocol (SNMP) Sensor
This bandwidth sensor is of three types which are;
(i) Library
(ii) RMON
(iii) Traffic
The Library sensor enables customized monitoring of your devices. It functions by building sensors with a Management Information Base record which then monitors devices via SNMP.
The RMON sensor uses SNMP to display transmitted packets, collisions, cyclic redundancy check errors, etc.
The Traffic sensor is the SNMP protocol itself.
Explore the Library Sensor, RMON Sensor and Traffic Sensor
IPFIX Sensor
This sensor distinguishes and shows traffic by type and traffic by channels for nodes that support IPFIX. The data displayed to you are below;
(i) Chat sessions (Internet Relay Chat and AIM Instant Messenger Chat).
(ii) File Transfer Protocol and P2P.
(iii) Remote Desktop Protocol sessions, Telnet, SSH, and VNC sessions.
(iv) Mail
World Wide Web
Citirx
Explore IPFIX
Cisco ASA Virtual Private Network Sensor
Cisco ASA means Cisco Adaptive Security Appliance and it is a name for Cisco Firewalls. In Cisco Firewalls, you can set up a Virtual Private Network and a type of VPN you can set up is IPsec. With the PRTG Network Monitor Cisco ASA VPN Sensor, all IPsec incoming and outgoing traffic on your Cisco Firewall will be monitored real time with SNMP.
Windows NIC Sensor
This PRTG Network Monitor Sensor uses Windows Management Instrumentation along with Windows Performance Counters to display bandwidth utilization, packets sent and received, errors e.t.c on a Network Interface Card.
NetFlow Version 9 Sensor
The NetFlow version 9 sensor is similar to the NetFlow Version 5 sensor. It shows traffic by type and traffic by channels for devices that support NetFlow Version 9. The data it shows you are shown below;
(i) Chat sessions (Internet Relay Chat and AIM Instant Messenger Chat).
(ii) File Transfer Protocol and P2P.
(iii) Remote Desktop Protocol sessions, Telnet, SSH, and VNC sessions.
(iv) Mail
(v) World Wide Web
(vi) Citirx
The next PRTG Network Monitor Bandwidth Sensor on the list is the jFlow sensor.
jFlow Sensor Version 5
The jFlow sensor provides you traffic by type and traffic by channels for devices that support jFlow sensor version 5. The data it shows you are shown below;
(i) Chat sessions (Internet Relay Chat and AIM Instant Messenger Chat).
(ii) File Transfer Protocol and P2P.
(iii) Remote Desktop Protocol sessions, Telnet, SSH, and VNC sessions.
(iv) Mail
(v) World Wide Web
(vi) Citrix
Cisco ADSL Sensor
This PRTG Network Monitor Sensor uses SNMP to retrieve ADSL data from a Cisco router. It shows you upload and download speed, SNR, device power, and attenuation. Also, it can display attenuation for a physically present device and a remote device.
Customized Sensor
The last on the list of sensors in the PRTG Network Monitor is customizing your sensor. This allows you to add sensors as you choose.
The video below shows you a valuable way for PRTG Network Monitor Bandwidth Monitoring.
We’ve covered bandwidth monitoring extensively, the first feature of the PRTG Network Monitor. We now move to the second feature which is alerting.
(2) PRTG Network Monitor Alerting
PRTG Network Monitor is designed with several alert modes such as email alerts, push notifications for mobile devices (Android, iOS), audio alarms, SMS, and EXE executable files.
With the PRTG Network Monitor alerting feature, you can modify your alert preferences to suit your needs such as daytime and nighttime, set dependencies, and design your own alerts using the PRTG Network Monitor Application Programming Interface (API).
(3) PRTG Network Monitor User Interface
The user interface comes in web form, desktop app, android, and iOS applications. The web form is Ajax based and enables you to view the Graphical User Interface via your browser. The desktop app is an Enterprise Console, it provides you the flexibility of use when you have multiple instances of PRTG. With the Enterprise Console also, you can view several Core Servers in one interface and the mobile apps enable usage on your mobile devices.
A remarkable feature present with the user interfaces is that you can access them securely with SSL. Each type of user interface is SSL protected while accessing the GUI locally or remotely.
(4) PRTG Network Monitor Failover
Backup, Failover, Redundancy are all synonyms of an efficient system or application. The PRTG Network Monitor is designed with a cluster backup feature such that two core servers work together in real time. In the event that the primary server goes down, the secondary server takes over the functions of the primary server seamlessly. Every instance of PRTG Network Monitor installation comes with a single failover license.
It is worthy of note that in the past, the version of PRTG Network Monitor that is hosted didn’t have monitoring for high availability, but today it is now available.
(5) PRTG Network Monitor Map/Dashboard Display
With this network monitor, you can view your entire network in real-time using maps. Also, you can design your own dashboard using over 300 features built into the map builder and incorporate all your network nodes. When done with this, you can share the URL of your map locally or outside your network.
To see how to create your own maps, watch the video below;
(6) PRTG Network Monitor Distributed Monitoring
The PRTG Network Monitor comes with a distributed monitoring feature that enables you to monitor multiple network locations with remote probes. With this feature, you will also be able to monitor your local network and any PRTG version that is hosted. Every PRTG Network Monitor license comes with unlimited probes for remote monitoring. With this, you can monitor your client locations and improve the service delivery they are getting.
(7) PRTG Network Monitor Reporting
Reporting is extremely essential for an application of this magnitude. Without reports, the application is useless. The PRTG Network Monitor comes with a very robust reporting capability. You can schedule reports to run automatically at any time of the day, week, or month. With the reporting feature, you can also run reports immediately and get them in CSV format, PDF format, XML, and HTML formats. You will be able to see every important statistic or data for every node or application you are monitoring.
PRTG Network Monitoring Every Service
It’s amazing to know that all we’ve talked about so far is just a part of a whole lot more that PRTG Network Monitor can do. Let’s take a look into the other services this tool is able to monitor.
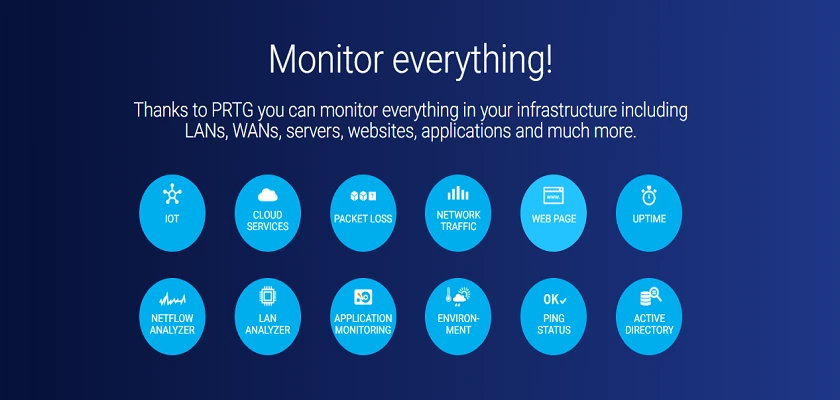
PRTG Network Monitor can monitor Applications, Cloud, Hardware, Network, and Service performance.
Let’s look at each of these and explain them further.
(1) PRTG Network Monitor Application Monitoring
Under Application Monitoring, the first feature you get is a Log Monitor. Let’s see what the Log Monitor is all about.
Logs Monitor
Now, this log monitor is a combination of Windows Event Log (API/WMI) and Syslog Receiver. The Windows Event Log gives you detailed system log information and application log information. These logs are on per second basis, if at any point in time these logs increase, the PRTG Network Monitor will notify you with alarms.
To make your use of the log monitor flexible, Paessler has made it customizable, whereby you can personalize your dashboard and customize your alarms.
The video below shows how to customize your filters on data from Syslog.
The next feature under Application Monitoring is SharePoint Monitor.
SharePoint Server Monitor
The SharePoint Monitor is based on the WMI protocol along with Windows IIS and Performance Counters. These enable monitoring of your SharePoint Server and enable you to see the following data;
(i) Page requests
(ii) All threads that are active
(iii) SQL queries
(iv) Memory utilization of active objects
(v) CPU utilization
(vi) Cache size and heap size
It is worthy of note that system performance can be degraded with too many sensors using the WMI protocol. It is recommended that you use sensors that are below 200 at a time.
Next on the list of features under Application Monitoring is Application Management.
Application Management
PRTG Network Monitor enables you to manage your applications conveniently and effectively. You are able to manage Web Servers, Mail Servers, Firewalls, SQL Servers (Oracle, MySQL, PostgreSQL), and any database that functions with OLE DB and ODBC.
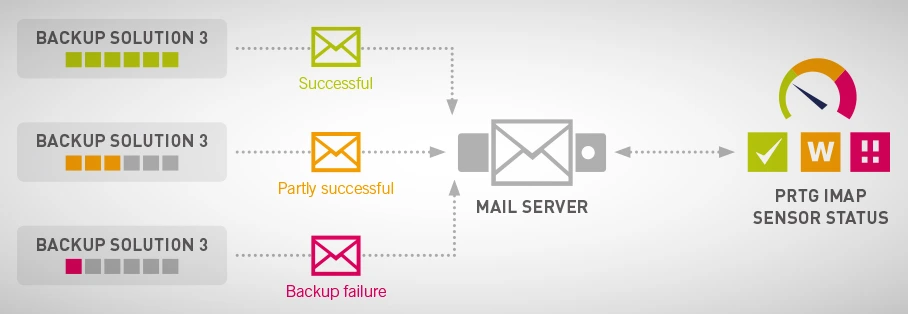
Backup/Storage Monitor
The PRTG Network Monitor backup feature is a sure monitoring and alerting mechanism for the progress of your backups, the status of existing backups, and error detection.
Next on the list of PRTG Network Monitor Application Monitoring features, is the Citrix Monitor.
Citrix Monitor
With the Citrix Monitor you can be rest assured that your entire virtualization, XenServer, and virtual machines are adequately monitored. Along with these, resource use is optimized, malfunctions and patch updates are automatically detected.
The Citrix Monitor also enables you to monitor at different levels which are;
(i) At the host level
(ii) Virtual machines
(iii) At the Operating System/Application level
(iv) At the Hardware/Server level
Mail Server Monitor
This feature monitors your mail and the reachability of your mail servers. It is built with IMAP sensors, POP3 sensors, and Simple Mail Transfer Protocol to scan the contents of emails, monitor the sending and delivery of emails. Also, with the Email Server Monitor, you can receive text messages and push notifications. You can also customize the notifications according to your needs.
MS Exchange Server Monitor
Similar to the Email Server Monitor, the Exchange Server Monitor ensures the reachability of your Server real time. It ensures your mails are sent and delivered accordingly with alerts and notifications. The Exchange Server Monitor is designed with the following sensors;
(i) PowerShell Mailbox
(ii) PowerShell Database
(iii) PowerShell Backup
(iv) PowerShell Mail Queue
(v) PowerShell Public Folder
(vi) WMI Server
(vii) WMI Transport Sensor
Hyper-V Monitor
Virtualized systems are very critical systems that must be adequately monitored and optimized. With the PRTG Network Monitor, your Hyper-V virtual environments are sure to perform optimally. Your entire cluster and hosts, virtual memory, volumes, CPU utilization, traffic are all monitored real-time and you can view all of this information in a simple dashboard.
Internet Information Services Monitoring
The IIS feature functions straight away after your PRTG installation is complete. It scans your IIS Servers and ensures the optimal performance of your webpages. The following information will be displayed for you;
(i) Transmitted/received packets
(ii) Total number of files transmitted/received
(iii) Total number of rogue users
(iv) CGI requests
(v) GET/POST requests
(vi) Errors
Linux Networks Monitoring
PRTG Network Monitor is able to monitor Linux-based systems also and doesn’t require you to make any change on the device to be monitored. Specially designed sensors for Linux and Unix are used to effectively monitor these systems. WBEM is used for Linux Serves while SNMP is used for Linux Operating Systems.
File Change Monitoring
This feature enables you track file changes, every file type is monitored and you will be alerted for file changes and file integrity checks at every noticeable point in time.
(2) PRTG Network Monitor Cloud Monitoring
With cloud monitoring, PRTG Network Monitor is able to give you a whole lot of information for your entire cloud systems infrastructure. It is able to do this with the following sensors;
Cloud Sensor Monitoring Tool: Paessler has cloud locations in the United States, Asia and Europe. This cloud sensor is HTTP based, and with it, you can test your cloud systems in your geographical locations and get to know their performance status from where you are.
Email Server Monitor: This feature provides real-time monitoring of your server and is very helpful if you use different email providers. In the event of an outage, you are notified immediately. To get notified faster, you can customize the threshold values to suit your needs.
Ping Sensor Tool: This cloud-based ping sensor is used to ping your respective services all around the world. Paesller has Servers in different locations which are given below;
(i) In the United States, it is located in Oregon and North Virginia.
(ii) In Asia, it is located in Tokyo.
(iii) In Europe, it is located in Ireland.
VMware Monitor: PRTG Network Monitor is able to monitor your virtual machines, ESX and ESXI with its sensors built specially for VMware (SOAP and WBEM).
Microsoft OneDrive: PRTG is able also to monitor your Microsoft OneDrive storage and notifies you when your storage space is depleting.
Amazon CloudWatch: If you own multiple accounts with Amazon, this feature is extremely beneficial. All information from your different accounts is extracted by PRTG Network Monitor and shown to you in one dashboard. With PRTG, you can have your own monitor separate from the Amazon CloudWatch. PRTG provides you the following sensors;
(i) EBS
(ii) EC2
(iii) ElastiCache
(iv) ELB
(v) RDS
(vi) SNS
(vii) SQS
Dropbox: Similar to Microsoft OneDrive, PRTG Network Monitor is able also to monitor your Dropbox storage and notifies you when you storage space is depleting.
Google Analytics: PRTG Network Monitor can provide you with website traffic information and it uses the Application Programming Interface from Google to do this.
Google Drive: Your Google Drive storage space is constantly monitored and you are notified when your storage space is depleted.
Microsoft Azure Monitoring: With PRTG Network Monitor, you can monitor everything in your Azure environment. You can see your virtual machine(s) performance, subscription cost, database, and storage.
Docker: Here, your Docker containers are monitored, specially built sensors are provided for Docker environments and you can manage your applications efficiently.
MaaS: This means Monitoring as a Service. With Paessler, you can get a special service hosted by them. This avails you the opportunity of Paesller managing everything for you. To learn more about this click here, you also get a 10-day free trial.
Cloud Network Monitoring: With this, Paessler can monitor your entire infrastructure for you and you do not need to set up a Server. This service has very flexible pricing, automatic updates, suitable for all Operating Systems, and is fully cloud-based. Click here to learn more and get a 10-day free trial.
SaaS: Paessler provides you with monitoring of your SaaS deployments using PRTG Hosted Monitor. You can choose any geographical location for this service and the service is hosted on AWS Servers. Learn more here and get a 10-day free trial.
Subscription Monitoring: This gives you the flexibility of having a subscription-based service with prices you can choose from and cancel at any point in time. See the full list and free trial here.
Now, we move to hardware monitoring.
(3) PRTG Network Monitor Hardware Monitoring
With PRTG Network Monitor, you can have as much information as you want with regards to all your hardware. Below is a list of what PRTG delivers to you;
(i) Storage Area Network Monitoring.
(ii) Monitors Server health and data center conditions.
(iii) Cisco, Dell, Linksys, IBM, and TP-Link devices.
(iv) QNAP, LDAP, Virtualization, Printers, and UPS.
Next, we take a look at Network Monitoring.
(4) PRTG Network Monitoring
This is the core of the PRTG Network Monitor, everything you need to know about your network infrastructure is available with this tool. All that you can get is outlined below;
(i) Network troubleshooting.
(ii) Network overview and mapping.
(iii) Optimization.
(iv) Traffic monitoring.
(v) Internet performance and bandwidth utilization.
(vi) IP Address scanning.
(vii) Audit.
(5) Service Performance Monitoring
PRTG will provide you service performance with all of the following features;
(i) SNMP and WMI monitoring.
(ii) Audit/Monitoring of your Active Directory.
(iii) FTP, SSH, and SSL monitoring.
(iv) Updates
(v) VoIP
(vii) VPN
(vii) Website/Webserver monitoring.
(viii) QOS, NTP, DHCP, DNS, MOS, and MSP monitoring.
A Simple Representation of the PRTG Network Monitor Features and Specifications
| PRTG Network Monitor | Latest Version (22.2.76.1705) |
| Pricing | Free Version (100 Sensors) Click here for Paid Subscription Prices |
| Type of Monitoring | Entire Infrastructure |
| API | Supported |
| Onsite Deployment | Yes |
| Cloud Services | Yes |
| Dashboard Customization | Yes |
| Mobile Support | Yes |
| Alerts | Yes |
| Reports and Customization | Yes |
| Agent Type | Agentless |
| Languages Supported | 9 |
PRTG Network Monitor Pros and Cons
| PROS | CONS |
| Robust IT Infrastructure Coverage | It’s expensive when you choose licensing according to sensors |
| Flexible Deployments |
Conclusion
PRTG Network Monitor is packed full of features but many do not harness the full potentials of these features due to lack of detailed information. This PRTG Network Monitor review and detailed teaching has gone deep in bringing out every vital detail needed to help you make the most of this powerful monitoring tool.
We hope that with our detailed review, you can proceed to harnessing the benefits therein.